MEANING
Demand is that specific quantity of a commodity which the consumer purchases at a specific price during a specified time period.
ACCORDING TO FERGUSON
“Demand refers to the quantities of commodity that the consumers are able and willing to purchase at each possible price during a period of time, other things being equal.”
ACCORDING TO BENHAM
“The demand for anything at a given price is the amount of it, which will be bought per unit of time at that price.”
ACCORDING TO VEERA ANSTEY
“The demand for a particular good is the amount that will be purchased at a given price at a given time.”
ACCORDING TO HANSEN
“By demand, we mean the quantity of a commodity that will be purchased at a particular price and not merely the desire of a thing.”
Thus, the demands for a commodity is the desire to purchase a commodity backed by the sufficient purchasing power and the willingness to spend.
ELEMENTS
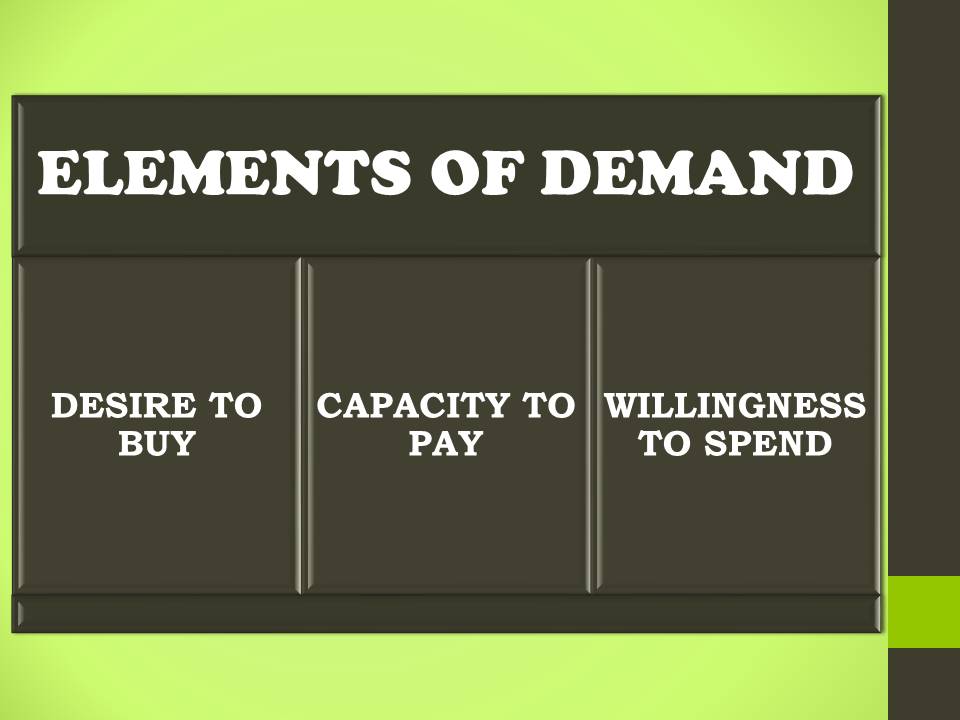
DESIRE TO PURCHASE A COMMODITY: Demand arises only when there is any kind of desire to purchase a commodity. If there is no desire, no demand arises.
CAPACITY TO PAY: Something can be purchased only when human being has something to pay for it. It means the person should be capable to pay the price for the commodity demanded. The price of the commodity is paid in terms of money.
WILLINGNESS TO SPEND: The consumer should also be willing to spend the money to purchase the commodity. If the consumer has the resources, but he is not willing to spend, then his desire cannot become a demand.
Thus, it refers to the willingness and ability of consumers to purchase a given quantity of a good or service at a given point of time or over a period of time.
DEMAND SCHEDULE
It is the table showing the relation between different quantities of a commodity to be purchased at different prices of commodity.
ACCORDING TO SAMUELSON
“The table relating to price and quantity demanded is called the demand schedule.”
It may be:
INDIVIDUAL DEMAND SCHEDULE
It is the schedule of one consumer. It shows the various quantities demanded by an individual at different prices of that commodity, at a point of time.
It can be shown as:
| PRICE OF GOOD X | QUANTITY DEMANDED OF GOOD X |
| 1 2 3 4 5 6 | 6 5 4 3 2 1 |
The table shows the negative relationship between the quantity demanded and price. When the price is ₹1, the consumer makes purchase of 6 units. When price rises to ₹6, the quantity demanded decreases to 1 unit.
MARKET DEMAND SCHEDULE
A market consists of all those individuals who want to purchase a given commodity. Market demand Schedule is a table showing different quantities of a commodity that all the buyers or consumers in the market are ready to buy at different possible prices of the commodity at a point of time.
It can be shown as:
| PRICE OF GOOD X | QUANTITY DEMANDED BY CONSUMER ‘A’ | QUANTITY DEMANDED BY CONSUMER ‘B’ | QUANTITY DEMANDED BY CONSUMER ‘C’ | MARKET DEMAND |
| 2 4 6 8 10 | 5 4 3 2 1 | 6 5 4 3 2 | 4 3 2 1 0 | (5+6+4)= 15 (4+5+3)= 12 (3+4+2)= 9 (2+3+1)= 6 (1+2+0)= 3 |
The table shows the different quantities demanded by consumers ‘A’, ‘B’ and ‘C’ at different prices. The total of their demands become the market demand which is 15 units at the price of ₹2 and falls to 3 units when price of commodity increases to ₹10.
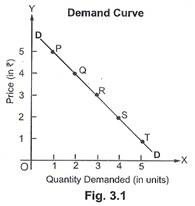
DEMAND CURVE
It refers to the graphic presentation of different quantities demanded at different prices of the particular commodity.
ACCORDING TO LEFTWITCH
“’The demand curve represents the maximum quantities per unit of time that consumers will take at various prices.”
ACCORDING TO R.G. LIPSEY
“The curve which shows the relation between the price of a commodity and the amount of the commodity the consumer wishes to purchase, is called demand curve.”
It may be:
INDIVIDUAL DEMAND CURVE
A curve which shows the quantity demanded for a particular commodity by an individual consumer at various prices of that commodity during a specific time period is known as Individual Demand Curve. It is negatively sloped curve that shows the inverse relationship between price and quantity demanded.
MARKET DEMAND CURVE
A curve which shows the quantity demanded for a particular commodity by all the consumers present in the market at various prices of that commodity during a specific period of time is known as Market Demand Curve. It is the sum up of the amounts demanded by the various consumers.
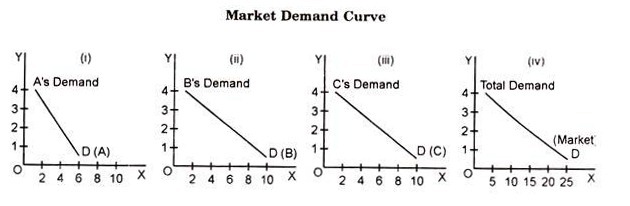
It shows the horizontal summation of the individual curves.
QUANTITY DEMANDED
Quantity demanded refers to the specific quantity to be purchased against a specific price of the commodity.
Example: A consumer buys 8 units of a commodity if the price is ₹6.