BREAK EVEN ANALYSIS GRAPH
Break even analysis graph
Break even Analysis is the analysis of three variables viz. Cost, Volume and Profit, which explores the relationship existing amongst Costs, Revenue, Activity Levels and the resulting Profit. It is also known as Cost Volume Profit Analysis.
ACCORDING TO CHARTERED INSTITUTE OF MANAGEMENT ACCOUNTANTS, LONDON
“CVP the study of the effects on future profit of changes in fixed cost, variable cost, sales price, quantity and mix”.
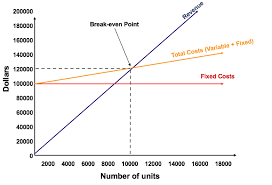
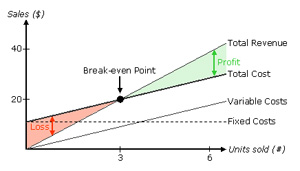
The break-even point in any business is that point at which the volume of sales or revenues exactly equals total expenses or the point at which there is neither a profit nor loss under varying levels of activity. The break-even point tells the manager what level of output or activity is required before the firm can make a profit; reflects the relationship between costs, volume and profits. In another words breakeven point is the level of sales or production at which the total costs and total revenue of a business are equal.
Break-even sales = (Contribution at break-even point /PV ratio)
OR
Fixed cost / PV ratio
At Break-even point or level, the sales revenues are just equal to the costs incurred. Below Breakeven point level the firm will make losses, while above this level it will be making profits. This is so because that while the variable costs vary according to the variations in the volume or level of activity while the fixed costs do not change.
BREAK EVEN ANALYSIS GRAPH
The break even analysis graph is as follows:
ASSUMPTIONS OF BREAK EVEN ANALYSIS
The CVP analysis provides useful results only when certain assumptions are made, such as:
- Fixed Costs do not change.
- Profits are calculated on the variable costs basis.
- All variables per unit remain constant.
- There is a single product or a constant sales mix in case of multiple products.
- Costs can be accurately divided into fixed and variable components.
- The analysis apples only to short‐term horizon.
- The analysis applies to a relevant range only.
- Total costs and total revenues are linear functions of output.
OBJECTIVES OF BREAK EVEN ANAYSIS/COST-VOLUME-PROFIT ANALYSIS
The objectives of cost-volume profit analysis are given below:
(1) In order to forecast profit accurately, it is essential to know the relationship between profits and costs on the one hand and volume on the other.
(2) Cost-volume-profit analysis is useful in setting up flexible budgets which indicate costs at various levels of activity.
(3) Cost-volume-profit analysis is of assistance in performance evaluation for the purposes of control. For reviewing profits achieved and cost incurred the effects on costs of changes in volume are required to be evaluated.
(4) Pricing plays an important part in stabilizing and fixing up volume. Analysis of cost-volume-profit relationship may assist in formulating price policies to suit particular circumstances by projecting the effect which different price structures have on costs and profits.
(5) As predetermined overhead rates are related to a selected volume of production, study of cost volume relationship is necessary in order to know the amount of overhead costs which could be charged to product costs at various level of operation.
ADVANTAGES OF BREAK-EVEN ANALYSIS
(I) IT PROVIDES DETAILED AND CLEARLY UNDERSTANDABLE INFORMATION: The chart visualizes the information very clearly and a glance at the chart gives a vivid picture of the whole affairs. The information is presented in a simple form and therefore, is clearly understandable even to a layman.
(ii) PROFITABILITY OF DIFFERENT PRODUCTS CAN BE KNOWN: The profitability of different products can be known with the help of break-even charts, besides the level of no-profit no-loss. The problem of managerial decision regarding temporary or permanent shutdown of business or continuation at a loss can be solved by break-even analysis.
(iii) EFFECTS OF CHANGES IN COSTS CAN BE STUDIED: The effect of changes in fixed and variable costs at different levels of production or profits can be demonstrated by the graph legibly.
(iv) CONSIDERS RELEVANCE OF FIXED COST: The break-even chart shows the relative importance of fixed cost in the total cost of a product. If the costs are high, it induces management to take measures to control such costs.
(v) PROVIDE ANALYSIS OF VARIOUS VARIABLES: The economies of scale, capacity utilization, and comparative plant efficiencies can be analyzed through the break-even chart. The operational efficiency of a plant is indicated by the angle of incidence formed at the intersection of the total cost line and sales line.
(vi) Break-even analysis is very helpful for forecasting, long-term planning, growth and stability.
LIMITATIONS OF BREAK-EVEN ANALYSIS
Though break-even analysis has gradually become service tool for modern financial management, there are certain objections raised against the utility of break-even analysis:
(i) Fixed costs do not always remain constant.
(ii) Variable costs do not always vary proportionately.
(iii) Sales revenue does not always change proportionately.
(iv) The horizontal axis cannot measure the units sold in as much as many unlike type of products are sold by the same enterprise.
(v) Break-even analysis is of doubtful validity when the business is selling many products with different profit margins.
(vi) Break-even analysis is based on the assumption that income is influenced by changes in sales so that changes in inventory would not directly affect income. If marginal costing is used, this assumption would hold good but in other cases, changes in inventory will affect income because the absorption of fixed costs will depend on production rather than sales.
(vii) Condition of growth or expansion in an organisation are not assumed under break-even analysis. In actual life of any business organisation, the operation undergoes a continuous process of growth and expansion.
(viii) Only a limited amount of information can be presented in a single break-even chart. If we have to study the changes of fixed costs, variable costs and selling prices, a number of charts will have to be drawn up.
(ix) Even simple tabulation of the results of costs and sales can serve the purpose which is served by a break-even chart, hence there is no need of presenting the data through a break-even chart.
(x) The chart becomes very complicated and difficult to understand for a layman, if the number of lines or curves depicted on the graph are large.
(xi) The chart does not provide any basis for comparative efficiency between different units or organizations.